The Big Picture
- This study is the sequel to the earlier study done in collaboration between Eastdil Secured and Nancy Packes Data Services, “The Great Migration.”
- We are pleased that this report is on a much more positive note. As in the earlier study, we measured migration patterns and job creation to understand their impact on rents in the City. Here, in addition, we have added lease transaction volume, which is a harbinger of even better things to come. We have divided the boroughs into core and non-core areas and defined them below the specific borough charts.
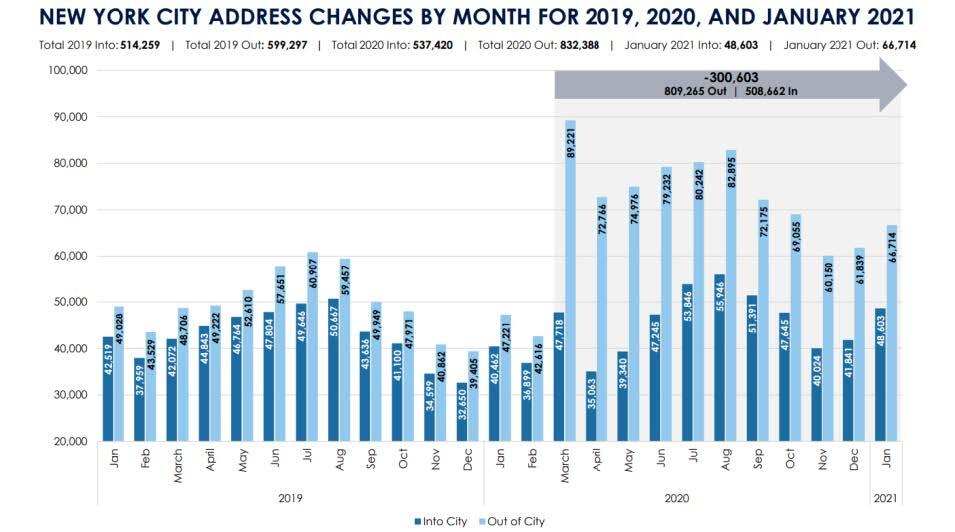
- There is always inward and outward migration in the City. To understand the effect of Covid on these patterns, we have subtracted 2019 migration levels from 2020 and 2021 levels to gauge the Covid impact. While March and April saw large increases in migration from the previous year, 68,193 in those two months and 220,885 in total to date, the net outward figure has been in decline since May. Fewer people are leaving the City, and more are returning. At the current rates, the City will return to positive inward migration in April 2021. Please see charts below.

*The numbers in the chart above represent changes in inbound and outbound migration from 2019- present.

- Outward migration was the result of pandemic fears and job losses. Inward migration began to increase well before the advent of any vaccine, based on job creation that began in June, while the pandemic was still raging. The job recovery began much sooner in the current crisis than it did after the Global Financial Crisis (GFC).
- Many people who have yet to return to the City are waiting for schools to reopen. As can be seen in the appendix to this document, half of the departing households went to counties around the City, presumably where they had second residences, because the speed and volume of the initial migration was too rapid for purchases to have been made. Also, there is very little rental housing availability in counties such as Fairfield and Suffolk.
- The other half dispersed to 200 counties throughout the country, presumably because of college and university closures and job losses. Many of them are already returning, anticipating schools reopening and with jobs returning to the City.
- Compared to the GFC, the City lost 4.18 times as many jobs and the nation, in a surprising correlation, lost 4.2 times as many. Yet, despite the size of the losses, jobs are rebounding quickly. The industries that comprise most of the demand for luxury, or attended, rental housing in the City are Finance, Business Services, and Information. We have also studied E-commerce, brick-and-mortar Retail, and Hospitality jobs as these also have an impact, mainly on the lower end of the rental market.
- We also analyzed the shifting industrial landscape, job growth and wage growth, to project the probable effect on the rental market in various areas of the City. The most notable shift is the increase in Information jobs and wages and the stagnation of Finance jobs.
- Given the hybrid work from home models that many companies have adopted, we believe most people working for companies with offices in the City will live in the City, even if they are farther out in the boroughs.
- Post GFC, from 2009-2011, 10,130 market rate rental units came to market in core Manhattan. Today, the three-year pipeline of market rate rentals in core Manhattan reflects only 1,489 units. Core Brooklyn’s three-year pipeline of 2,800 units is about 40% below the same metric from 2008. Only Queens is looking at a larger pipeline today than in 2008, but with only 2,261 units it is still a fraction of what was delivered in post GFC and, therefore, will not impede rent growth.
- Non-core areas have larger pipeline volumes, but typically absorb very quickly because of lower pricing.
- After many months of job creation, rents have begun to rise. By January 2021, rents began to rise in core Manhattan. By February, core Brooklyn, non-core Brooklyn, and non-core Queens followed. And finally, by March, rents in non-core Manhattan and core Queens were growing as well.
- Currently, rent in core Manhattan is 4.6% above the low, in core Brooklyn rents are 2% above the low, and in non-core Queens an incredible 22%. Non-core Manhattan, non-core Brooklyn, and core Brooklyn have all begun growing but not yet by a substantial amount.
- The virtuous cycle of job creation leading to inward migration leading to rents increasing is well underway.
- All rental data in this study is from Nancy Packes Data Services Transactions and Pipeline Databases. All charts and rental data not displayed in the text can be found in this link. (Homeward Bound Charts)
The Shift in the Industrial Landscape


Finance
- Since the Global Financial Crisis, Finance jobs have seen the least amount of growth locally, as 3,300 jobs have been added equalling just 1%. Nationally, Finance jobs have grown by 7.6%. Reduction in jobs in the City is due to the growth and implementation of technology as the largest companies, with the greatest degree of technoligical innovation, have eliminated many jobs (see MIT Technology Review article “As Goldman Embraces Automation, Even the Masters of the Universe Are Threatened”).
- Because of this industrial transformation, Finance is the only industry in the City where wages are below the national average. Average wages in Finance are now about 6% below Information wages, while just before the GFC they were slightly higher. The automation of Finance jobs is the reason, and AI is only just starting.
- The inference from this is that nationally, Finance Is heavily reliant on consumer banking whereas the City is dominated by investment banking.
- Finance recovery in NYC is the slowest of the industries, and full recovery is expected in June 2025. On the National level, a much smaller percentage
Information
- NYC is becoming a global hub for Information, and since the GFC, Information employment in NYC grew by 22% while on the national level it never recovered to pre-GFC levels. In NYC, Information jobs grew by 38,500, twelve times more than Finance.
- Currently, Information workers have the highest average compensation in the City, as hourly wages rose from $33 in 2008 to just under $50.
- Due to Covid, NYC lost 7% of its Information workers and the nation 11%.
- Locally, Information jobs rebounded the fastest, recovering to pre-Covid levels by December 2020. A large amount of Information jobs can be performed remotely, allowing for the faster recovery.
Business Services
- Surpassing both of these indsutries is Business Services that added 201,300 jobs locally since the GFC, or 33% of its employment. Business Services, being the largest industry in the City that supports luxury rental demand, closely relates to Manhattan rents. Interestingly, Both recovered in 2011 after the GFC. (See appendix)
- Wages on the other hand grew slower than the other two industries, going from $32.48 to $42.68.
- Business Services had grown exponentially as a result of growth in Finance and Information jobs after the GFC. Depending more on personal contact however, Business Services employment cratered due to Covid, losing 123,500 jobs locally, 15.3% of the industry. Full recovery is expected in May 2022.
Nonstore Retail
- At both the national and local level, the fastest growing industry since the GFC was Non-store Retail as E-commerce has exploded over the last decade. In the City, Non-store Retail nearly doubled since the GFC growing 90.8%.
- It is interesting to note that nationally, wages remained stagnant at $35 from 2008- present but in the City, wages rose from $32 to $47, competitive with top industries, another of the shifts transforming the industrial landscape.
- On a national level, Nonstore Retail jobs rebounded faster than any other, recovering in August 2020. In the City, there is still a way to go, but only 2,000 jobs were lost. Based on the current linear rate of growth, full recovery is expected in February 2024.
Brick & Mortar Retail
- After the GFC, brick-and-mortar retail grew in the City until 2015, and nationally until 2016, but from then employment levels remained stagnant. Local job growth since the GFC was 10.6% and nationally, 1.9%.
- Wages In NYC grew from $17 in 2008 to a current average of $23.50, putting it just above that of Leisure and Hospitality workers.
- As we know, brick-and-mortar was more than decimated due to Covid. Locally, 35% of the industry was lost but is recovering 6,877 jobs per month and full recovery is expected in September 2021. This fast recovery is largely due to the initial easing up of lockdowns.
Leisure and Hospitality
- Leisure and Hospitality jobs experienced a fast rebound and strong growth after the GFC and jobs grew 43% in the City and 26% nationally.
- This strong growth in jobs is in part due to the low cost of employment and growth of wages, as they only grew from $18 in 2008 to the current $22.
- Hospitality is the wildcard in regards to recovery where, according to the Federal Reserve Bank of Atlanta, decline in business travel seems likely to change Hospitality employment for the foreseeable future. Based on the linear projection, recovery in NYC is expected by August 2022.
Summary
- Since the Global Financial Crisis, jobs in the City have grown at nearly double the national rate, 22.2% vs 11.5%. And, since the industries measured are primarily urban, the implication is that the City has been growing faster than other cities since the GFC.
- With the exception of brick-and-mortar retail, all industries had overall linear growth patters from the GFC to pre-covid. All recovery projections are, therfore, based on a linear trend but it is likely that recovery will speed up as vaccines become more available.
- While Information is the only industry that has fully recovered in the City, recovery in the other industries is projected at a faster rate than after the GFC since the cause of the crisis was not financial and vaccines are becoming more available by the day.
- The average recovery time after the GFC for these industries was 37 months in NYC. In comparison, the average projected recovery from Covid is 28 months, a 24% faster recovery.
Analysis by Borough
Manhattan
- In Manhattan, declining rents were initially caused by pandemic related migration, not job losses, increasing from 12,000 in February to over 40,000 in March. The total exodus from Manhattan since March is 339,990 compared to 222,552 and 153,495 for Brooklyn and Queens, respectively. These figures account for out-of-city movement as well as interborough and intraborough address changes.
- • In Manhattan, most of the migration was to areas outside of the City, whereas in Queens and Brooklyn much of the movement was to other boroughs and areas within the City.
- This greater rate of outward migration corresponded to steeper rent declines compared to Brooklyn but similar compared to Queens.
- From the peak to trough, Manhattan average net rents declined 24% in core neighborhoods and 19% in non-core neighborhoods. Queens core neighborhoods declined 23%, and non-core 14%. Although the fall in core rents was very similar, non-core Queens rents were more resilient because they are lower. Brooklyn, with its rent between the two, had decreases in net rents of 20% in both core and non-core neighborhoods.
- It is interesting to note that, in non-core Manhattan, like core Queens, the number of rental transactions is heavily correlated to jobs in all industries. Non-core Mahattan, a less expensive alternative to the core neighborhoods, attracts residents from all professional backgrounds, as does core Queens, also a less costly location in the City. In 2020, non-core Manhattan and core Queens had the same exact average net rent, at $3,328, further illustrating that they share the same demand sources.
- In Manhattan, rents continued a steady decline until October 2020, when they began to stabilize. This stabilization in rents corresponds to an increase in inward migration, directly resulting from new job creation, particularly in Finance where new jobs began increasing in June.
- Finance jobs correlate significantly to Manhattan rents. Professional and Business jobs also correlate, but to a lesser extent.
- In core Manhattan, a promising indicator is that transaction levels are higher than pre-Covid. Transaction volumes have been increasing since May. There were some fluctuations in this trend during months with less job creation, further highlighting the correlation.
- Like rent, core Manhattan transactions track Finance jobs. Both were hit hard in March 2020 and continued to suffer until June when both begin increasing until they both peaked in August. Both finance jobs and transactions then saw monthly declines until November, but both finished off 2020 with growth beginning again in December.
- After a period of job growth in Finance and Business Services, beginning June 2020, Manhattan core rents finally began to increase in January 2021. The intervening months of job growth elevated transactions levels and absorbed accumulated vacancies, finally affecting rents in January. In essence, more jobs led to more transactions, that ultimately led to rising rents.
- What is critical to note is that people are leasing apartments in Manhattan even though many are not yet back in offices. Transactions from May-December of 2020 were 15% higher than at the same time frame a year earlier.

*Core reflects attended rental buildings from all neighborhoods south of and including the UWS and Manhattan Valley on the West Side and Carnegie Hill & Yorkville on the East Side.
Brooklyn
- Once Covid struck, there was an outflow of people from Manhattan and partly into Brooklyn and Queens, so that the effect of the migration out of the City from all areas was blunted in Brooklyn and Queens by Manhattan’s greater loss.
- In the outer boroughs, the large rent decreases did not start until May, whereas in Manhattan the effect was seen immediately in March and April.
- There were two main effects: migration out of Manhattan into the outer boroughs, presumably because of its density, and migration to better buildings in core from non-core areas in Brooklyn, for the same or lower rents than previously paid in non-core areas.
- Ultimately, core and non-core areas dropped equally because as core Brooklyn saw rents decline specifically from job losses, residents of non-core Brooklyn migrated into core neighborhoods. The steepest drop in non-core Brooklyn did not occur until after the fall in core neighborhoods. Still, non-core Brooklyn rents were buffered by their lower prices.
- From the peak in April 2020 to the low in January 2021, core and non-core net rents dropped 20%.
- Rents started to stabilize in core Brooklyn in October 2020 and to grow by January 2021, 3.1% from the low, as jobs in Information, Business Services, and Finance industries began to rebound, and migration into the borough increased.
- Core Brooklyn, the area with the second highest rents, correlates with Finance jobs, though not as strongly as Manhattan. Core Brooklyn also has a lesser, yet still significant, correlation to Information and Business Services jobs. An increase in jobs is generally followed by rent increases in the following 3-4 months.

*Core reflects attended rental buildings in Boerum Hill, Brooklyn Heights, Clinton Hill, Downtown Brooklyn, DUMBO, Fort Greene, Greenpoint, Park Slope, Vinegar Hill and Williamsburg.
Queens
- Queens, with the lowest rents of the three boroughs, benefits from entry level jobs in all industries and correlates with all industries. However, its rental patterns are most closely correlated with the lower paying jobs of the Retail and Hospitality industries. From January to June 2019, Hospitality jobs in the City increased an incredible 6.5%, which was reflected in Queens rents and transaction volumes increasing more than in the other boroughs.
- Like core Brooklyn, core Queens resisted the initial Covid migration because it benefitted from the Manhattan exodus but, by summer it also capitulated. From June 2020 to the low in February 2021, net rents in the area fell 23% the second steepest decline, right behind core Manhattan at 24%. While most migration out of Manhattan was out of the City and to other boroughs, most of Queens migration was from core to non-core neighborhoods, and the opposite of movement in Brooklyn.
- In Queens, 51% of migration was intra-borough, compared to 45% and 23% in Brooklyn and Manhattan, respectively. Thus, non-core Queens did not suffer as much as the other areas. As of February, net rents in non-core Queens were only 10% below pre-Covid levels and by March it was only 3.5%. Gross rents in the area were able to fully recover in March.
- The large migration out of core Queens as well as the sharp decline in rent can be attributed to the massive loss of jobs seen in entry level and low paying positions, as well as the loss of students who no longer are residing on or near college campuses.
- Although core Queens rents are still far from recovering, the combination of continued job growth and the sustained increase in transactions volume indicates that it will happen soon.

*Core reflects attended rental buildings in Long Island City and Hunters Point.
Foresight and Forecast
The Knock-on Revolution
Technology is like the mythological Greek God, Kronos, who eats his children. He is the god of time. Technology creates time efficiency but eliminates jobs. Initially, technology eliminated manual labor, now, with AI, it is encroaching on mental work. This is probably already manifesting in the Finance industry that has seen such sluggish wage and job growth over the past decade and is so amenable to automation. This is evolutionary and, therefore, inevitable. So, we should foresee all its potential benefits.
It is eroding the class system, with its inherent inequality. Look at the Tech Titans today and their modest origins. Humans are not predestined to labor and management roles. We need to grasp the greatest paradigm shift, that life is not a zero-sum game because we are all capable of being creators.
To realize this potential, we must educate people. In our country, one of the greatest impediments is the inability to reward teacher excellence in the public school system. This must change. The availability of learning tools through technology can help this transformation. We need to foresee these shifts in jobs and human capital to adapt with minimal dislocation and maximum benefit.
The Species as Group Animal
Humans are a social animal. Our history is of social grouping as hunters, tribes and nation-states defending the territory. The point is, no matter the level of structure, we function in groups. Perhaps the most intriguing notion in forecasting the future of this, or any city, depends on the radical transformation of life by technology. While we have all been witness to the adaptation to remote interaction, the Information industry worker is young and global, not just in national origin, but in how they see the world. It is all connected, and they are all connected. The desire to be together, in groups, is part of their DNA. And, generally, they are younger and not yet focused socially through their children.
Although they may spread out a bit more, they want to live in cities, to connect with their group and their interests. Our challenge will be to keep the others following them with better city schools, safety, an upgraded infrastructure and more investment in art and culture. DUMBO is a good model here.
Following the Trends
We can assume that job growth will continue in the post-Covid environment at a rate similar to what occurred in the years following the GFC. We infer this because, except for Finance, there was steady job growth generally and outsized job growth in Business Services and E-commerce.
With jobs recovering and migration trends turning favorable, we believe that demand for rentals in the City will continue to be strong going forward. This is supported by increasing rents and the uptick in transactions recently across the City.
This leaves supply as the final determinant for projecting rent recovery. The chart below compares new supply of market rate rentals in core areas after the GFC and today. As shown, the annual and overall figures are down significantly in the City in comparison to a decade ago.

Like during Covid, but on a lesser scale, NYC also saw rents fall during the GFC. Core Manhattan rents dropped nearly 15% from 2008-2009. The outer boroughs dropped, but not as much. The data is limited as the outer boroughs had just begun gentrifying. Therefore, Manhattan has been used as the basis for comparison here.
From the low in May 2009, full recovery occurred in the fall of 2011, two and a half years after the GFC. It is interesting to note that rents recovered in Manhattan at the same time as Business Services jobs, the most substantial workforce in the City supporting attended rental demand. It is also important to note that Business Services jobs are recovering at a much faster rate from Covid than from the GFC and are expected to recover by mid-2022.
As rents in many areas have already begun growing, with jobs recovering at a faster rate than after the GFC, with migration trends turning and with new supply much lower than post-GFC levels, we believe rents in the City will recover to pre-pandemic levels in less than two years.
Nancy Packes
April 9, 2021
To be added to our distribution list please email your name and contact information to [email protected]